

Story telling is the oldest form of knowledge sharing
Once you start collecting data that is associated with your business and the industry you operate in, the next challenge to extract value from it. Data is valuable only when insights are uncovered and translated into actions or business outcomes. Our team has the expertise to work on multiple enterprise solutions – Tableau, Power BI, R Shiny and JavaScript based charts and build a self-service, data science focused insight-to-value driving dashboards.
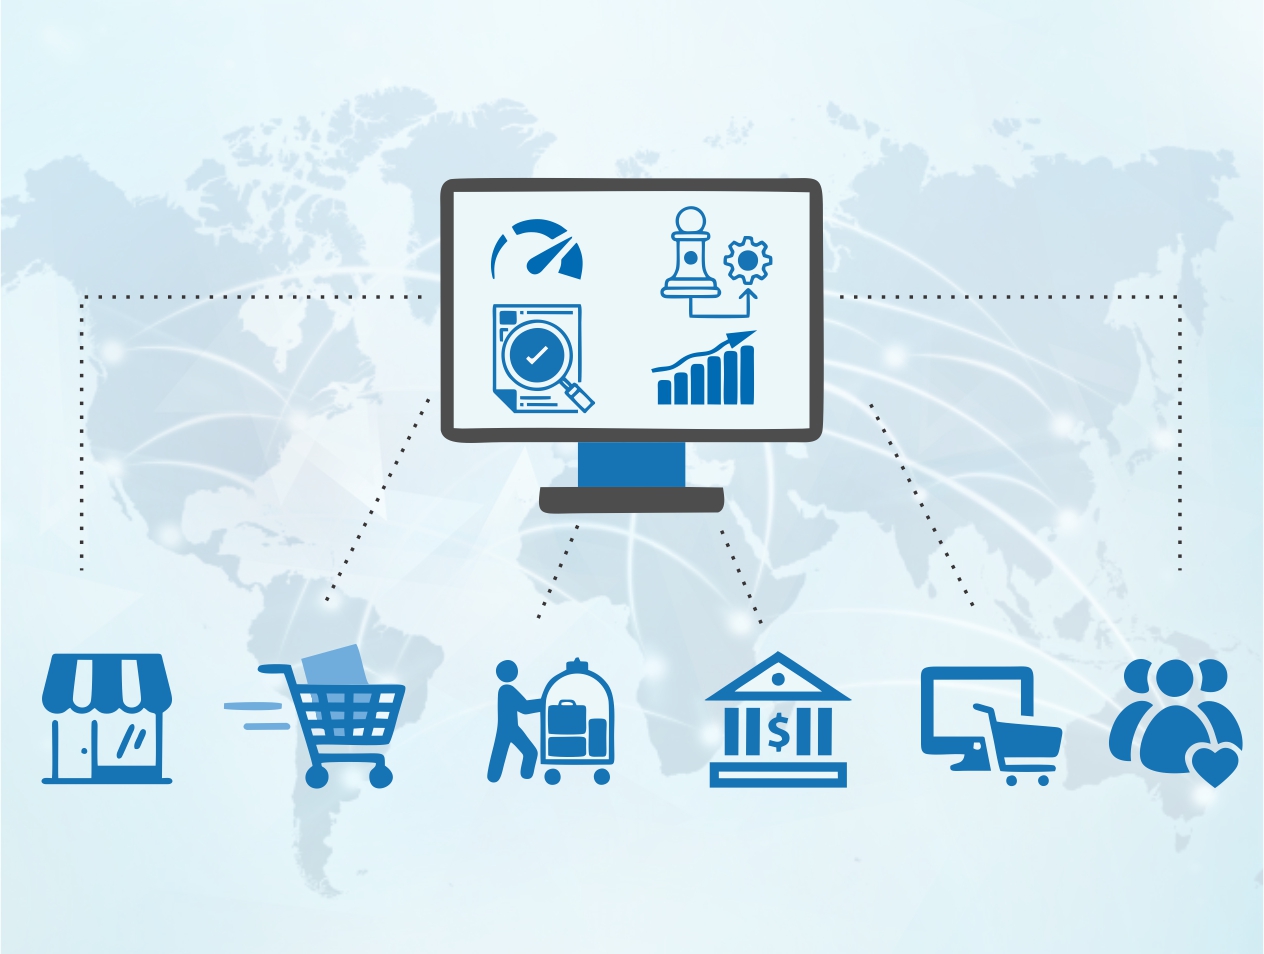
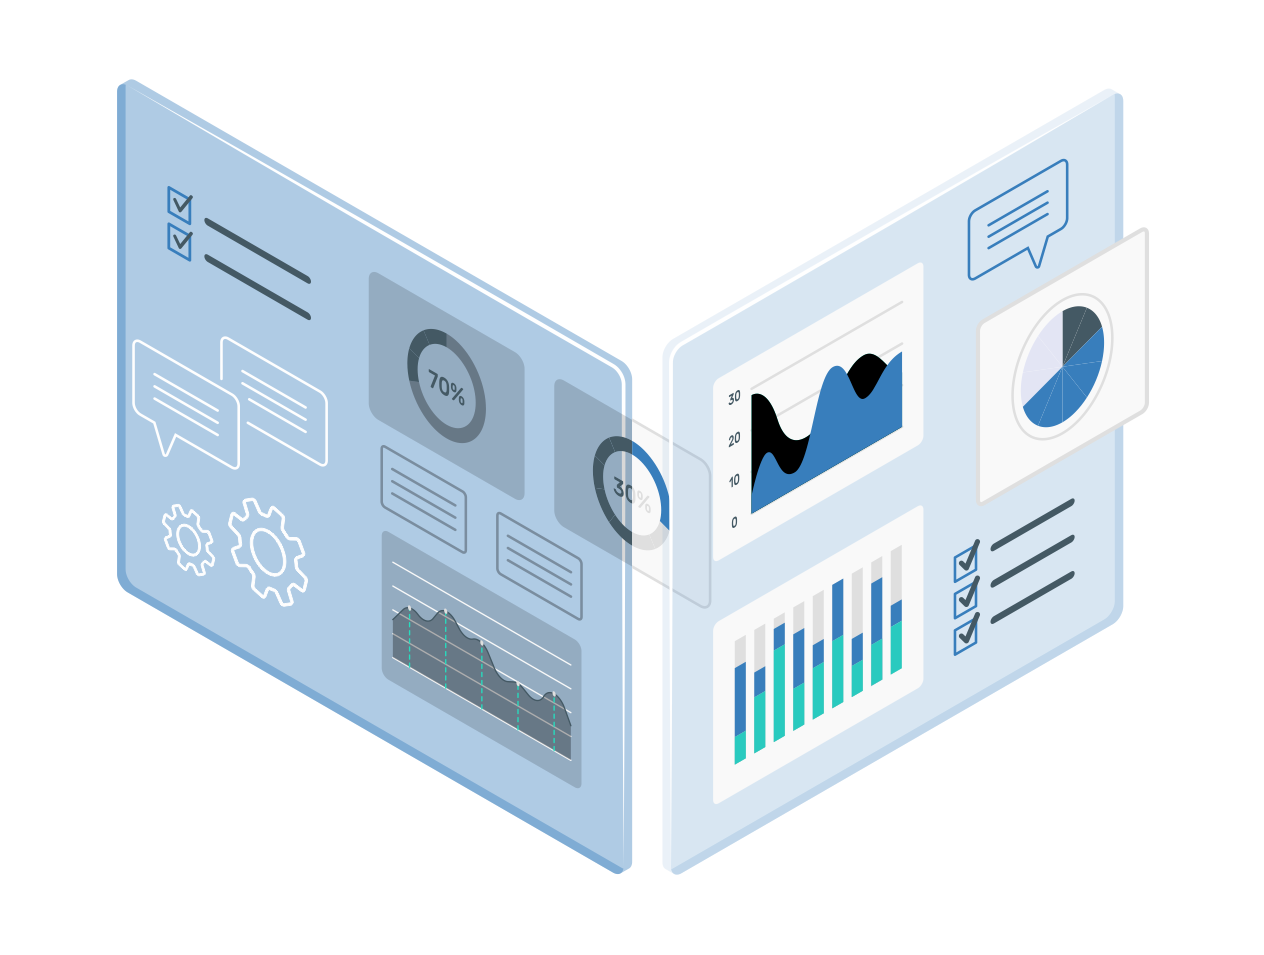
Our focus is not only on generating reports and visualizations, but on an exquisitely structured approach to communicate insights. It involves a combination of three key elements: data, visuals and a compelling narrative. When our team combines the visuals and narrative with the right data, a memorable data story is created that can influence and drive change.
Write to us and explore how we would solve the business problem you have using a data-driven approach with a measurable return on investment.
Our Services
Operational dashboards
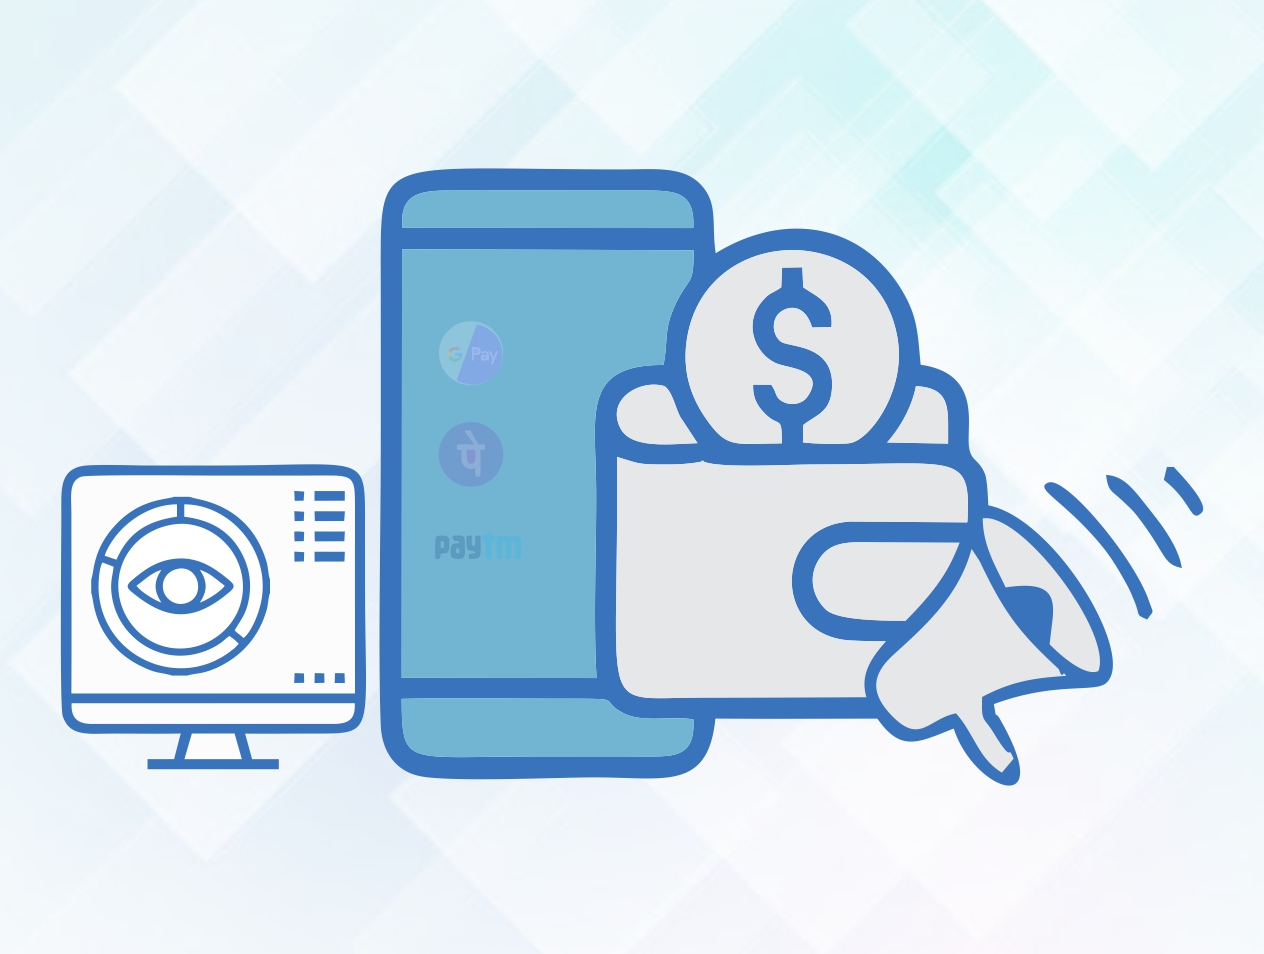
An operational dashboard is used to monitor business processes that require regular monitoring to track changes in performance metrics and KPIs. The data gets updated frequently, usually many times in a day and are used to monitor progress towards a target. Operational dashboards enable:
- Access to the latest information without having to collect data everytime, pre-process them and generate dashboards for regular use
- Access to the latest information for making on the go business decisions
- Identification of potential issues before they happen with the right metrics at hand
- A business adopt agile decision making process
Tactical dashboards
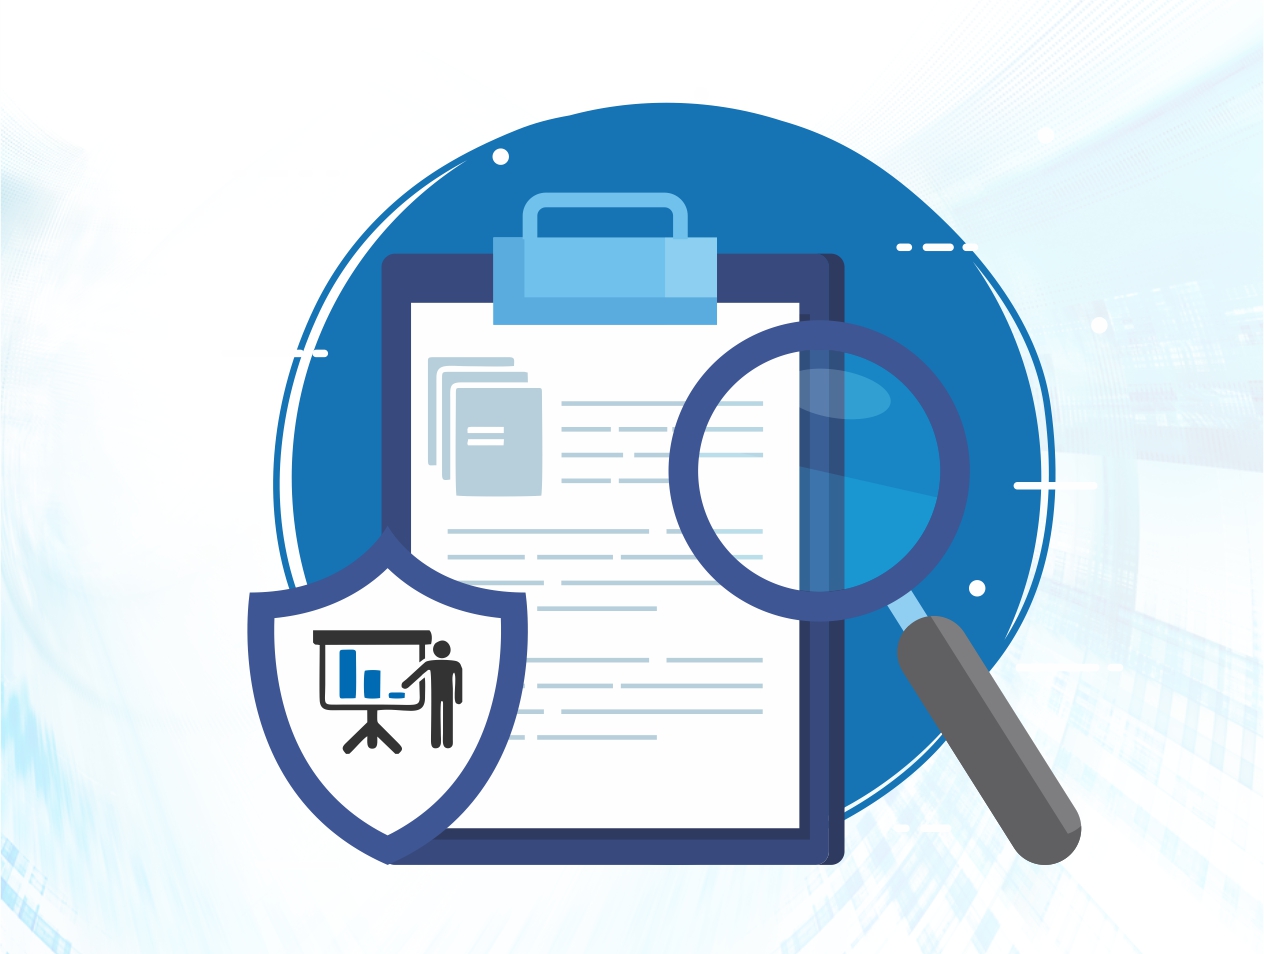
Tactical dashboards are usually utilized by management, with an emphasis on driving decisions using the analysis. These dashboards usually monitor the metrics that indicate the progress towards a goal and enable businesses come up with recommended actions. The tactical dashboards we build enable:
- Linkages between the levers to the business KPI
- Interaction between multiple dashboards to measure impact on the business KPI
- Insights based on filters and segmentations within the business
- Tactical decisions to reach the KPI goal
Analytical dashboards
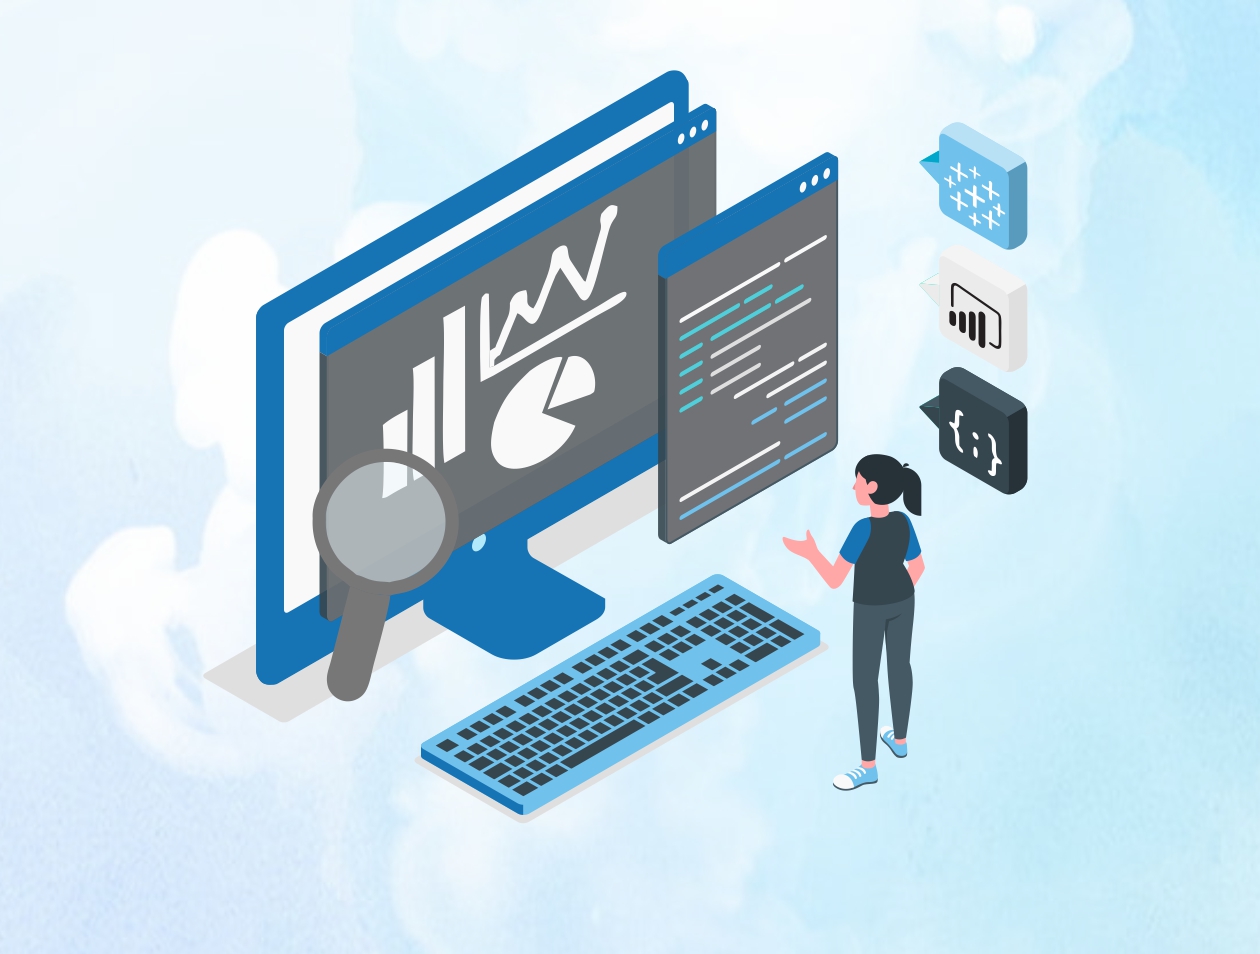
Our team specializes in advanced analytics, machine learning and AI. These skills enable us to think like a decision maker and build analytical dashboards that are useful, fast and serve the audience it is intended for. The analytical dashboards we develop:
- Have inbuilt data quality and validation checks to ensure accuracy of information
- Are designed to identify trends and predict outcomes
- Have excellent user experience and interaction focus
- Can generate insights and recommendations using machine learning & AI algorithms at the backend
Strategic dashboards
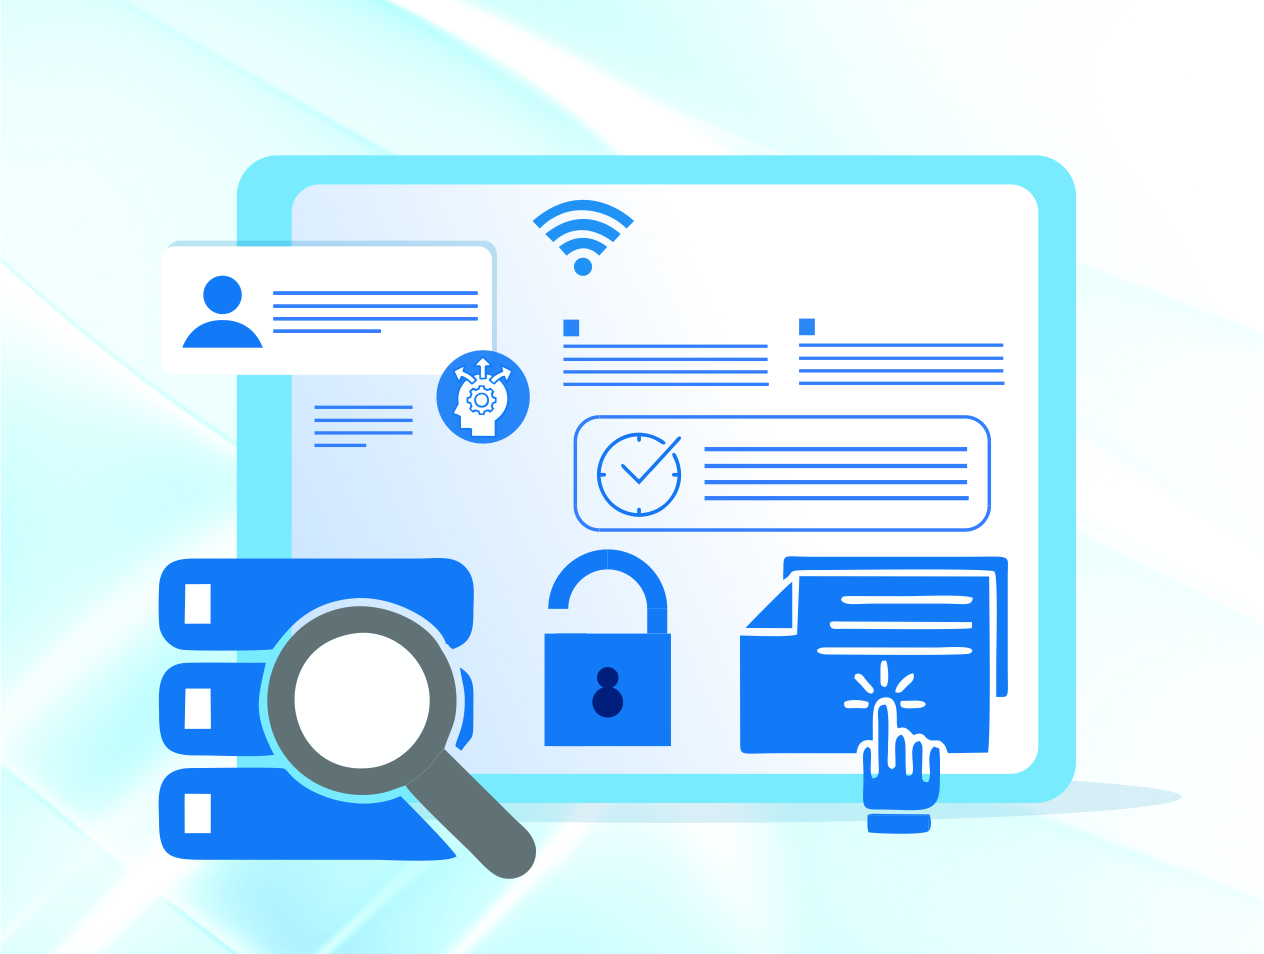
Strategic dashboards are designed to report on the long term impact and monitoring the progress of outcomes towards those goals. Since these are complex in nature, it requires careful design and layout to enable take up and usage. We build strategic dashboards with:
- A clear focus on simplicity and user experience
- Automated monitoring and recommendations of activities, subgoals and risks
- Summarize performance and progress towards the strategic goals over standard time frames - month, quarter, YoY, YTD etc.
- Combining qualitative and quantitative data into a unified story telling interface
Featured Clients


Related Case Studies & Blogs
A media agency used engagement driven proprietary index to segment influencers on social platforms. The me...
Generating eye catching visualizations and charts is becoming easier by the day. With the data deluge, and th...
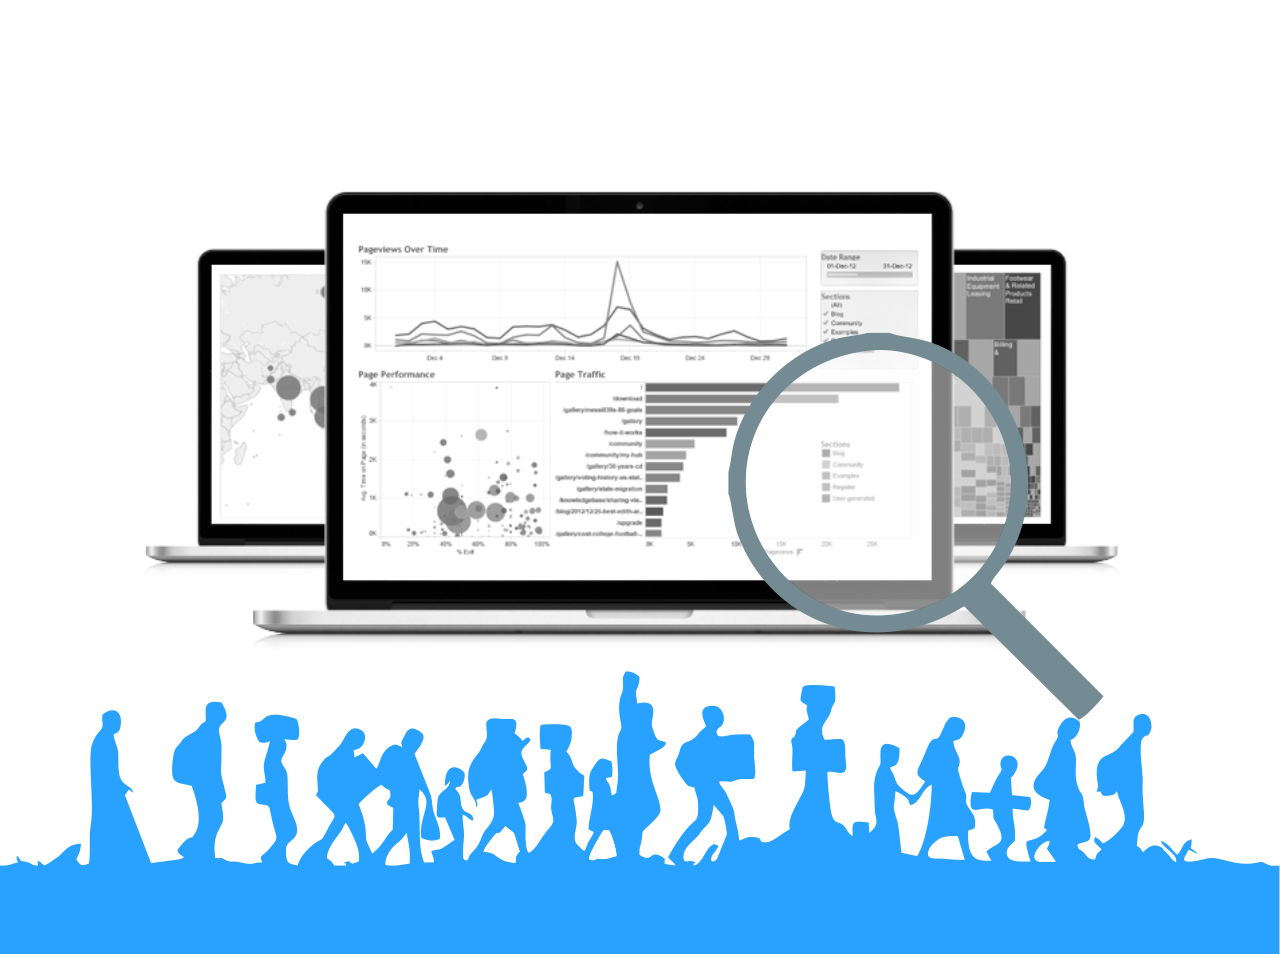
The European Network Against Racism (ENAR) used Tableau visualizations to highlight migrant plights. The n...